Multi-dimensional analysis of warranty data, enhancing data visualization, strengthening quality control, and improving production efficiency.
Warranty service is an important component of the warranty provider's business operations, and accurate warranty forecasting is a driving force customers satisfaction. Statistical analysis of warranty data, after-sales evaluation of product quality, and using warranty data to realize reverse logistics have long been neglected by warranty providers. A large amount of available information is hidden in massive warranty data yet it is difficult to effectively mine and hard to provide reliable references for the warranty provider's operational strategy.
The operation status of the enterprise's internal assets directly affects the production capacity and efficiency. Accurate fault prediction can demonstrate the enterprise's efficient production and operation. Long fault intervals, lost repair data, and unrecorded repair data make it difficult to analyze and organize asset repair data, and leads to difficulties for operators to understand status of the asset.
The Data Analysis can effectively solve the difficult problems of collecting, checking, and analyzing warranty data for users. It provides professional data processing and adds value to the data by analyzing it.
The Data Analysis function is mainly divided into six stages: data statistics, quality analysis, part statistics, warranty forecasting, warranty costs, and strategy-making:
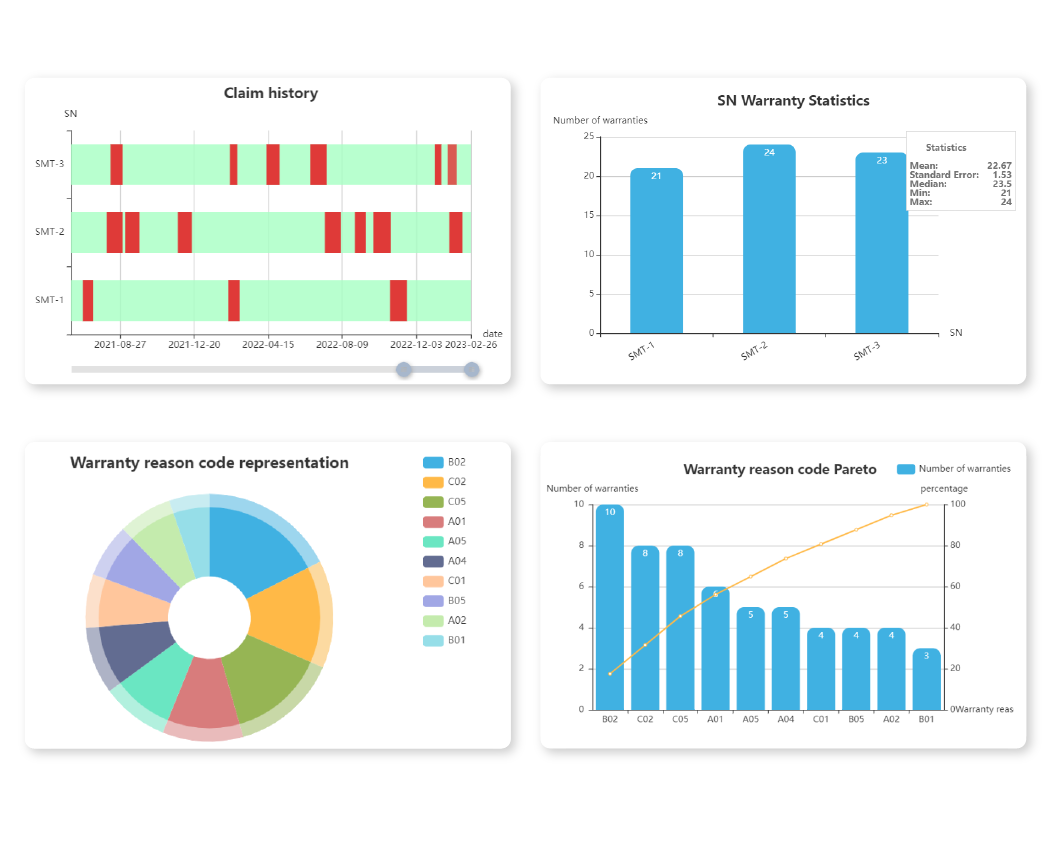
By filtering the massive data generated by warranty management and repair services, data counting and analysis are conducted to show the quantity of warranty claims by product, batch, machine, and part through charts.

Based on warranty data supplemented by manufacturing data, the quality of products is effectively analyzed to provide a solid and effective basis for process improvement and quality enhancement.

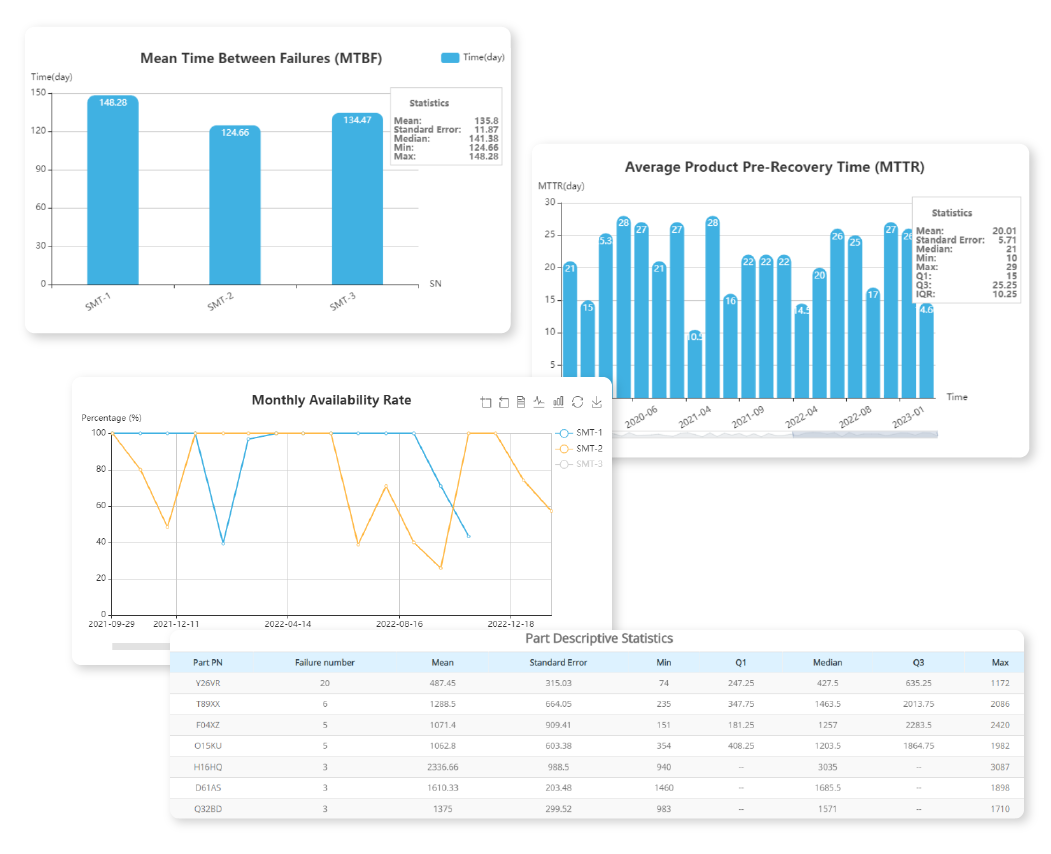
Obtain part replacement records and calculate part quality data to provide data basis for part replacement and estimation, and pre-stock based on the actual usage of parts to effectively shorten the waiting time.

Apply mathematical models to scientifically forecast future warranty and spare parts quantities, while maintaining high customer service levels, effectively control inventory investment, and increase asset return rates.

Adjust different service parameters using scientific forecast. Provide optimal cost-effective solutions through simulating warranty conditions and improve strategic decision-making accuracy.

Accurately control the occurred and estimating warranty costs.

wareconn will satisfy your imagination of warranty service information mining with its complete Data Analysis function.
Analyze repair data from multiple dimensions and enhance data visualization.
Statistically calculate the MTBF and failure rate of products, to strengthen product quality control.
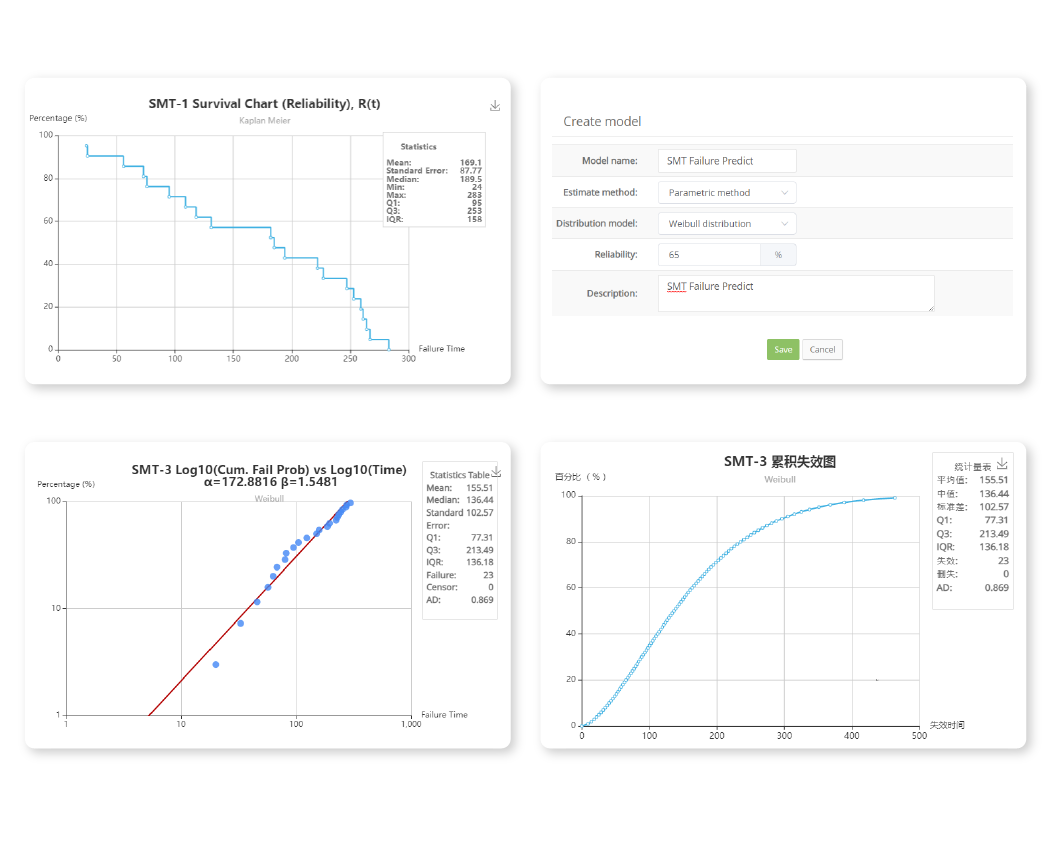
Using Weibull distribution model to forecast the next failure time or future warranty claims quantity and reduce operating costs.
Estimate the spare parts quantity based on the procurement cycle and safety stock coefficient to reduce costs and inventory.
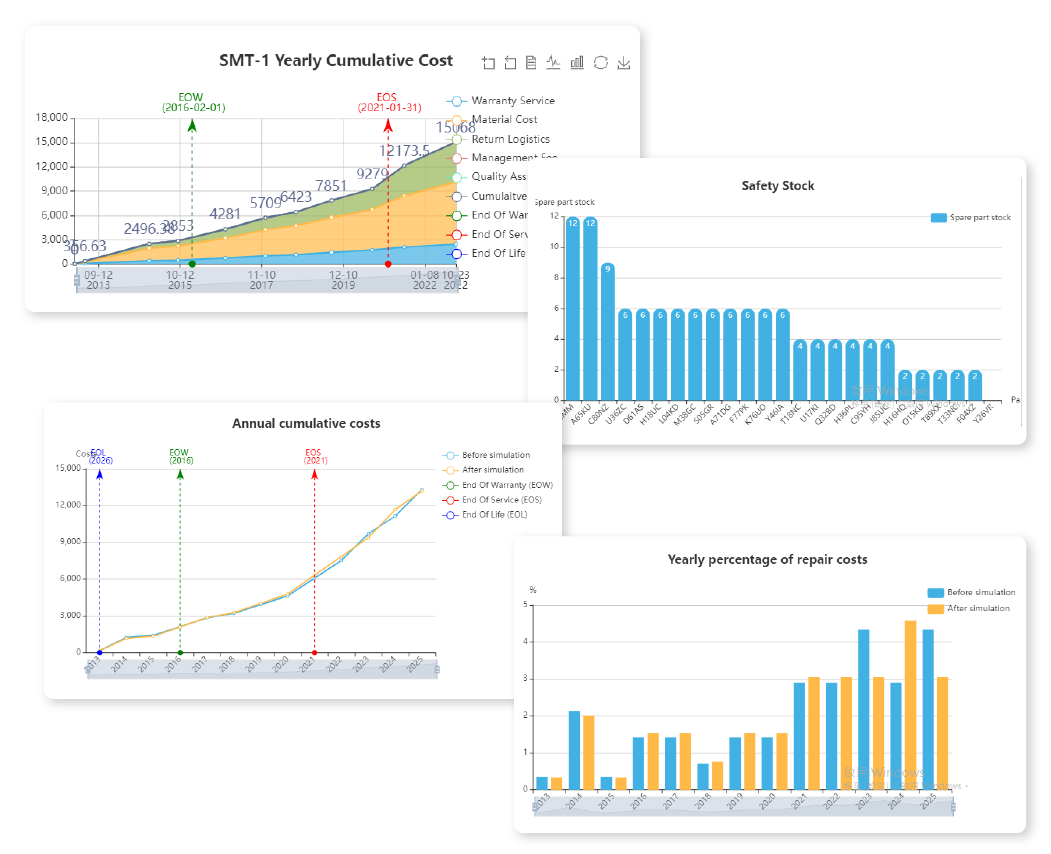
Calculate the warranty costs and estimate future costs to reduce operational risks.
Simulate warranty settings, calculate and compare the expected costs before and after simulation as a strategy reference.
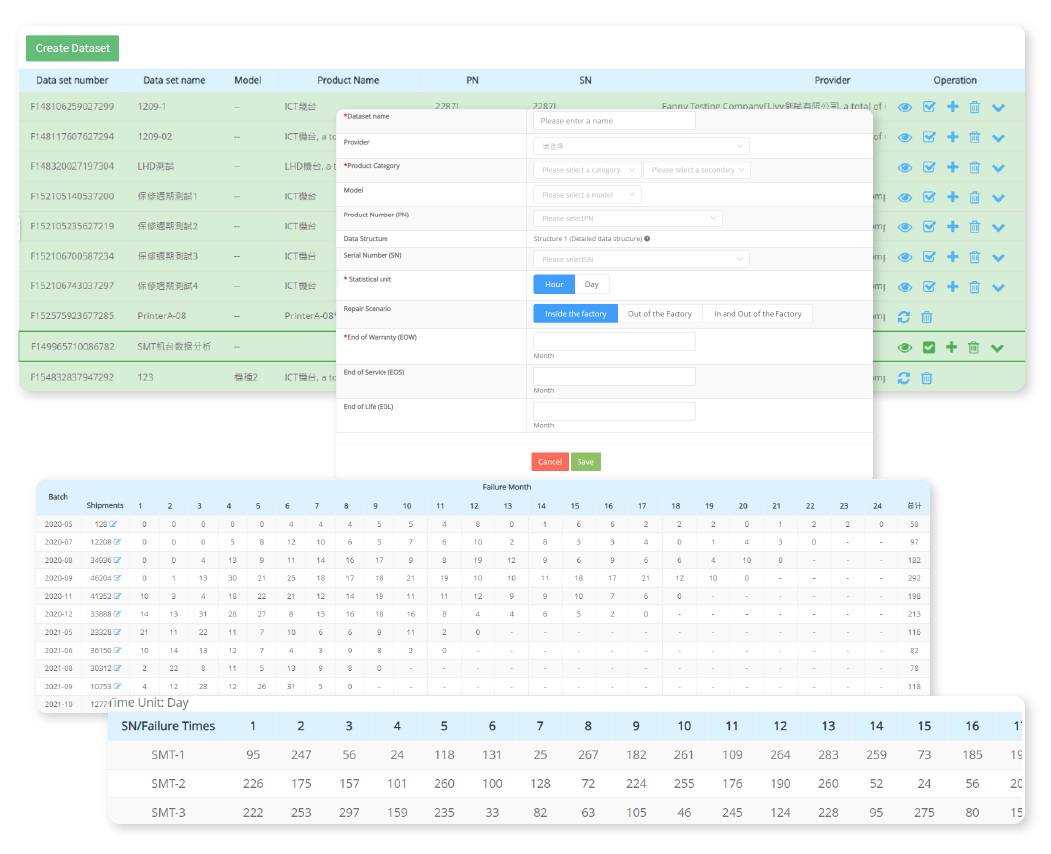
Create a data set
Build a massive data foundation
Fetch or upload shipping data
Bedding quality analysis
Get useful information from massive warranty data
Professional process warranty data
Analyze the warranty quantity based on factors such as customers and part numbers
Filter and process valid warranty data
Analyze defective batches based on factors such as batches and months of service
Filter and process valid warranty data
Analyze product defects and draw Pareto diagrams based on customer statement and warranty diagnosis
Solve diverse data types
Filter the warranty data of the parts under the product
Realize data value-added
Filter batch actual shipment data
Multi-dimensional statistical analysis of the failure rate of a batch
Filter actual product shipment data
Multi-dimensional statistical analysis of the failure rate of a product
Organize and analyze the effective data of the components under the product
Plot the frequency distribution of component failure time
Analyze the reasons for the failure rate
Combine shipping information and platform data
Customized analysis chart
Provide prediction model building conditions
Support multiple prediction model options
Weibull, three-parameter, index and other algorithms
Data mining, processing, analysis
Use mathematical models to estimate future warranty numbers and improve forecast accuracy
Optimize inventory indicators
Refer to the scrap rate and monthly production capacity to estimate the inventory of spare parts and improve the return on inventory assets
Historical warranty cost data collation
Analyze data according to products and customers
Relying on model prediction logic
Estimate future maintenance costs
Add future shipment data
Calculate the total cost of repairs for all shipments
Data science practical applications
Improve decision-making activities
Simulate warranty settings to obtain the best solution


Setting warranty and shippingdata

Filter valid data from massive data, and query warranty information at multiple levels

Analyze product quality from multiple dimensions through data processing.

Create and select models, use different models for the data and come out with different information.

Predict future warranty based on the statistics or even compare different models for the best result.

Input procurement cycle and safety stock coefficient, forecast spare part demand and calculate safety stock based on future warranty.

Classify and calculate warranty costs occurred, forecast the future to assist strategy-making

Forecasting and simulating reverse service to achieve maximum benefits
Automatically generate statistical graphs for product lifecycle, failure code, and product batch repair quantity based on the established dataset. It can also perform statistical analysis on part replacement quantity and lifespan. Users can complete preliminary data analysis based on the charts.