Insights
Warranty Data - Driving the Transformation of After-Sales Service-Part Two
2024-02-01 11:37:23
Warranty Data - Driving the Transformation of After-Sales Service-Part Two
Application Scenarios | ||||
Nowadays, technology is advancing rapidly, the focus of enterprise operations is often on creating core competitive products that generate revenue, whether in design or manufacturing. This is especially true for the introduction and application of Industry 4.0 in manufacturing systems. However, the warranty data in the operation process is often overlooked. This data's collection and effective management can directly and indirectly improve manufacturing efficiency and product quality. The final beneficiary is still the overall improvement of customer satisfaction. According to Table 1, all possible data sources and purposes in different industries and scenarios need to be checked for data accuracy before performing analysis. After summarizing and analyzing under the selected structure, it is finally managed by the system to effectively and timely provide valuable analysis results. According to the data characteristics, the data structure of individual scenarios can be summarized as follows. | ||||
| > | Structure I: | |||
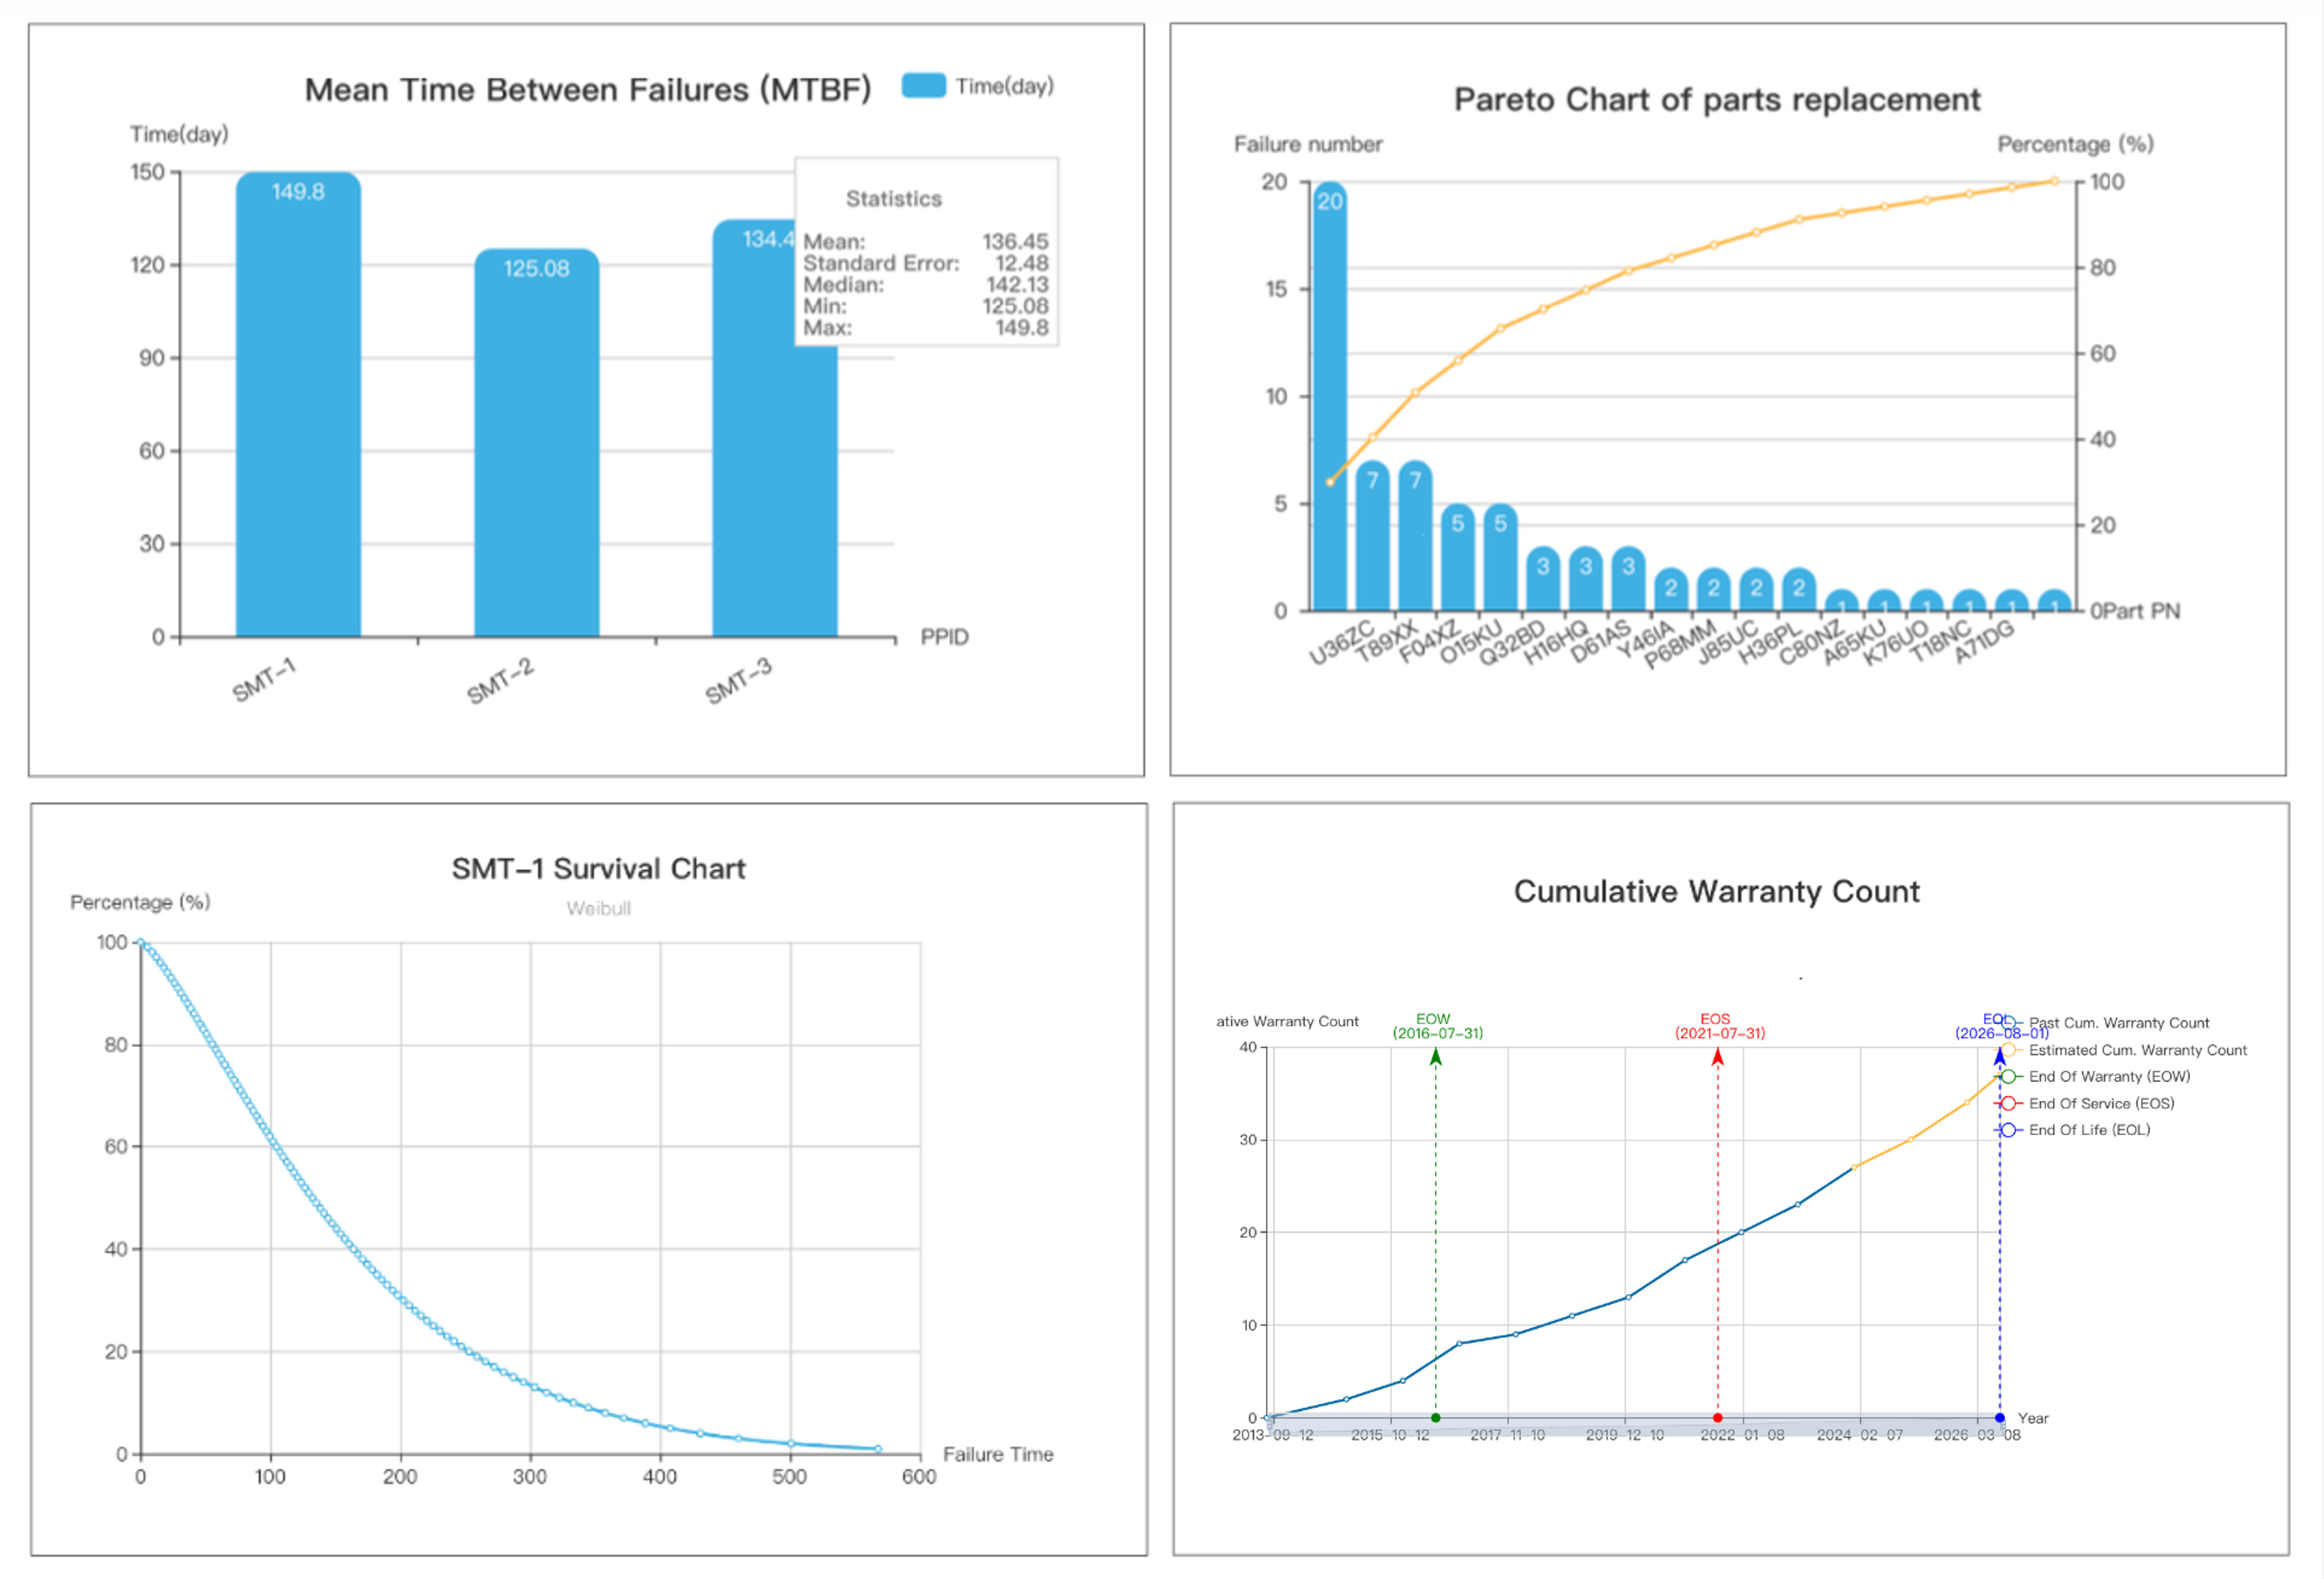
To effectively record the usage of a asset, including daily inspections and maintenance, as well as abnormal repair operations, the data can be collected in the form of structure I. It is applicable to the industry scenarios A1/B/C/D in Table 1, especially the equipment sales and manufacturing industry. After collecting and structuring the data, upon completion of checks and data analysis, the system can calculate the average time between failures for individual machines and maintain records of the replacement of abnormal components. Through reliability analysis of the machinery, it is possible to simulate the future failure rates within and outside different warranty periods, as shown in Figure 1.
| ||||
Figure 1 - Warranty Data Structure I: Asset Maintenance Case (a. MTBF, b, Number of Parts Replacement, c. Estimated Asset Reliability, d. Estimated Cumulative Warranty Claims) The purpose of the enterprise's collection of asset maintenance warranty data is most importantly to reflect actual operational performance indicators, whether it is maintenance costs and unexpected downtime losses. According to previous studies, the introduction of asset management systems should be able to reduce costs by at least 15%, while production efficiency can be greatly improved by more than 40%, and downtime can also be reduced by at least 35%. According to the analysis report of the National Institute of Standards and Technology in the United States in 2020, it is estimated that the annual loss caused by asset maintenance in the United States is nearly 193 billion US dollars. Particularly, maintenance costs account for 29.6%, while unexpected downtime losses account for 9.4%, and business losses caused by incidents amount to 51.7%, of which 16.1% is related to quality defects. Surprisingly, the loss caused by delayed shipments is as high as 35.6% [4]. The collection of warranty data is the basis for subsequent operation improvement, and plays an extremely important role in enterprise operation and service provision. | ||||
| > | Structure III: | |||
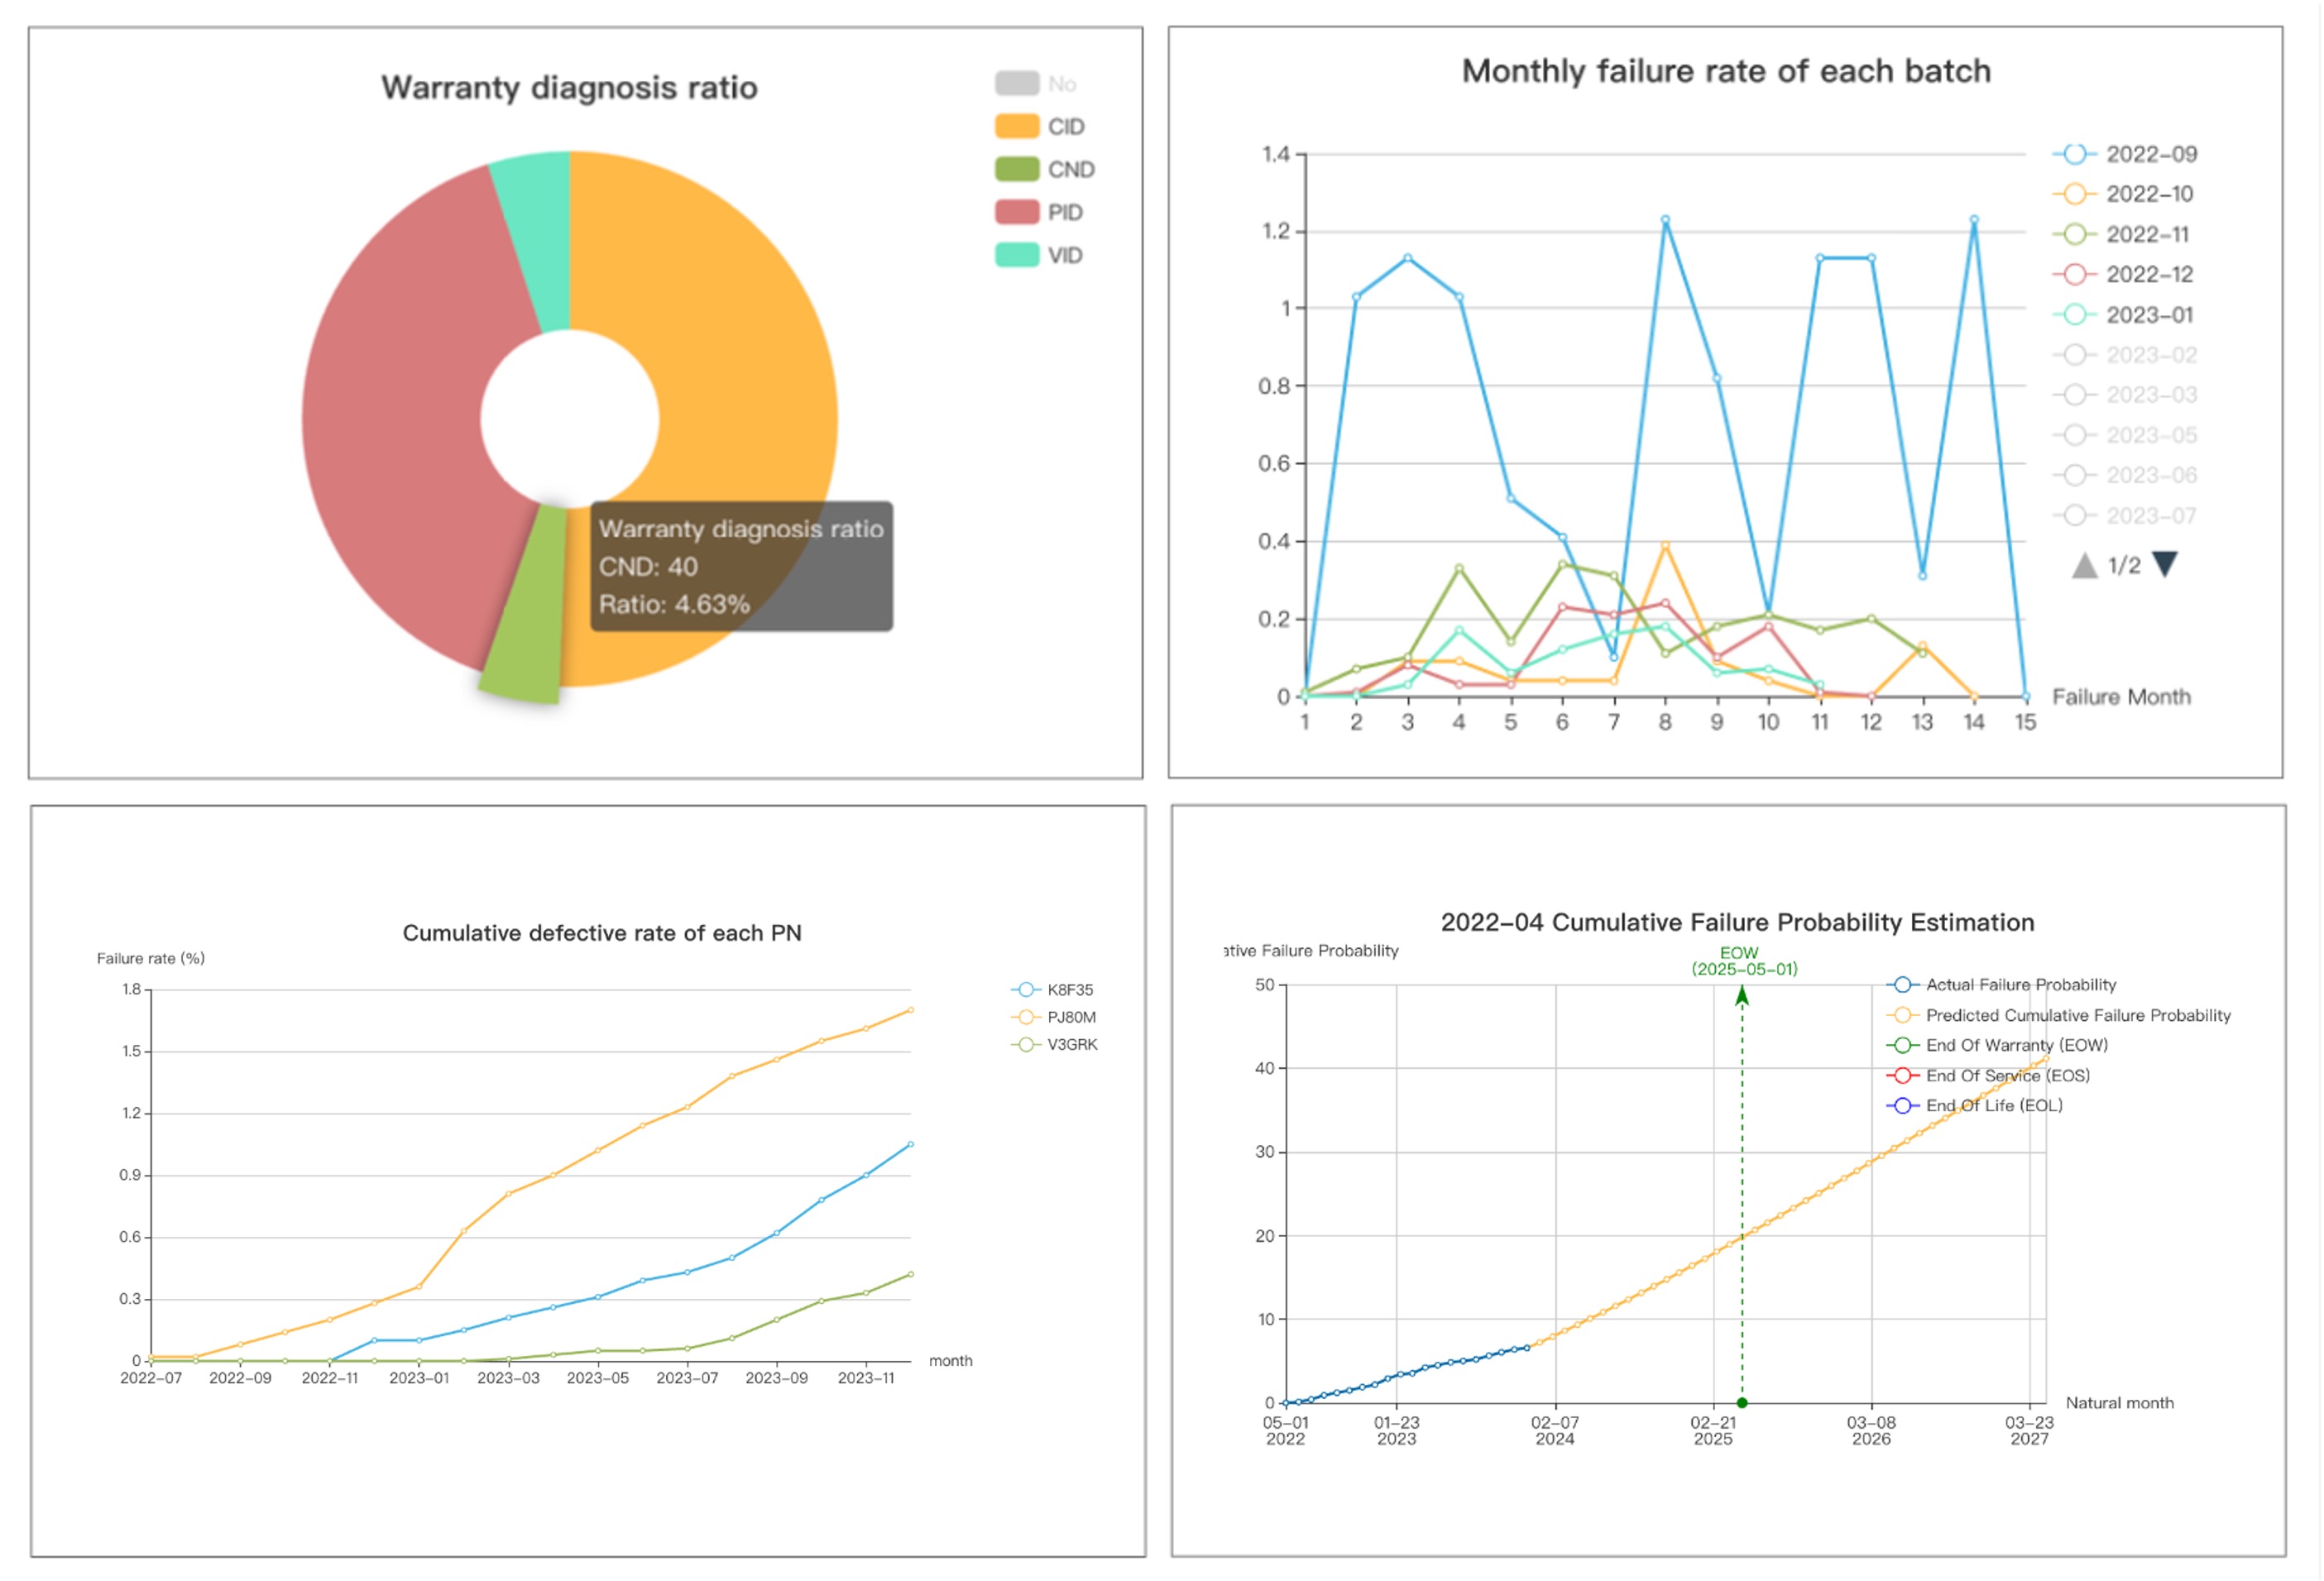
For businesses that primarily sell goods and services, when it comes to after-sales warranty operations, return for repair or exchange is the majority practice, the number of product failures can be recorded in the form of structure III. The purpose is to understand product quality and reliability estimation. As in the industry A2, C (depending on the specific material/semi-finished product) scenarios in Table 1, by tracking the replacement records of customer warranty claims, we can understand the cause of failures, the relationship between abnormality and usage time for different production batches, and even the differences in usage environment can be statistically derived. At the same time, the cumulative failure defect rate is used to understand the management of warranty costs and predict the proportion in the future, as shown in Figure 2:
| ||||
Figure 2 - Warranty Data Structure III: Return for Repair Case (a. Warranty Disposition Distribution, b. Production Batch Abnormality, c. Cumulative Failure Rate, d. Estimated Cumulative Failure Rate) The quality of the goods is seriously related to the enterprise's survival. Establishing an after-sales return and exchange warranty service process and conducting real-time warranty data analysis is an indispensable task for enterprises. The proportion of many industry's warranty costs is roughly the same as R and D costs. Refer to the Warranty Week analysis, in the past 5 years, the average warranty costs of the heavy equipment industry in the United States region is about 2.0%. Automobile manufacturing is about 2.4%, and the computer-related industry is about 1.5% [5]. While emphasizing the core value of enterprise R and D, it is impossible to ignore the acquisition of after-sales warranty data, which can effectively estimate the resources required for return and exchange management and service provision. | ||||
Data-Drive Change | ||||
Data is the basis of all analysis and transformative actions. After completing the data analysis and simulation, enterprises are more concerned about the actions generated afterwards. Based on the theoretical and data presentation, scientific discussions drive the change of operations and processes, effectively take measures to reduce operational risks, which is a cyclical operational management process. As shown in Figure 3, it explains the process of basic warranty data and operation improvement. Starting from the bottom of the figure, first establish the warranty data collection and structured data storage process, systematically integrate related warranty data (from customer claim for warranty, repair service to final cost). After collecting the data, use the analysis methods described earlier to perform different levels of analysis on different production batches, product numbers, models, and understand the main causes of return [6]. A PDCA cycle is often used to address anomalies and manage improvements. In warranty data analysis, enterprises can also use warranty data and quality analysis methods to verify and classify the problems found in the warranty data. After determining the direction, the enterprise's responsible unit can formulate improvement measures and implement actions. Then observe whether the warranty data and product quality of this production batch have eliminated this failure phenomenon, and continue the improvement cycle until the goal is achieved. | ||||
Figure 3 - Warranty Data Analysis and Improvement Process | ||||
Summary | ||||
IDC's 2023 Product and Service Innovation Survey emphasizes that currently about half of the products and asset are networked (49.6%), and this number will grow to more than two-thirds (67.2%) within the next three years. The amount of data that service teams need to filter is enormous. The goal must be to transform all these data into faster resolution times, availability, and customer actions [7]. Through data analysis and problem classification, find the direction of operation improvement, and use the quality assurance PDCA cycle within the system until the target is reached. Taking the information and communication technology industry as an example, the top 20% of large enterprises generally control warranty costs within 1.8%, the average service cycle is 5 days, and the proportion of warranty costs transferred to suppliers is more than 30% [8]. While enterprises are committed to enhancing core values, improving product functions and gaining market shares, after-sales warranty is often a neglected part but is a key that can directly affect customer satisfaction. The improvement of warranty operations should be re-examined in the establishment and determination of the organization's level. Improving internal operation quality through effective use of warranty data can significantly enhance the enterprise's core value. | ||||
Author
Dr. Albert Liao
Founder and CEO of Wareconn Technology Services (wareconn.com),
Author of “Warranty Chain Management - Digitalization and Sustainability”, Springer
Reference
- Stephane Scouchet, Vinodkumar Ramachandran, 2023, Future of smart industrials – KPMG Connected Enterprise for engineered products aftermarket and field service, KPMG internationals.
- Aly Pinder, 2023, Worldwide Service Life-Cycle Management Platforms 2023-2024 Vendor Assessment, IDC MarketScape, IDC #US49989623.
- Wallace R. Blischke, M. Rezaul Karim, D. N. Prabhakar Murthy, “ Warranty Data Collection and Analysis”, Springer, 2011.
- Douglas Thomas, Brian Weiss, (2021), Maintenance Costs and Advanced Maintenance Techniques in Manufacturing Machinery: Survey and Analysis, International Journal of Prognostics and Health Management.
- “Twentieth Annual Product Warranty Report”, warrantyweek.com, 2023
- Albert Liao, (2022),Warranty Chain Management - Digitalization and Sustainability, Springer.
- Aly Pinder, etc, 2022, Worldwide Manufacturing Product and Service Innovation 2023 Predictions, IDC Future Scape, IDC #US48627622.
- “Powering warranty reinvention, How electronics companies leverage new technologies to improve warranty management”, IBM Institute for Business Value, 2017.


