Dear valued wareconn user:
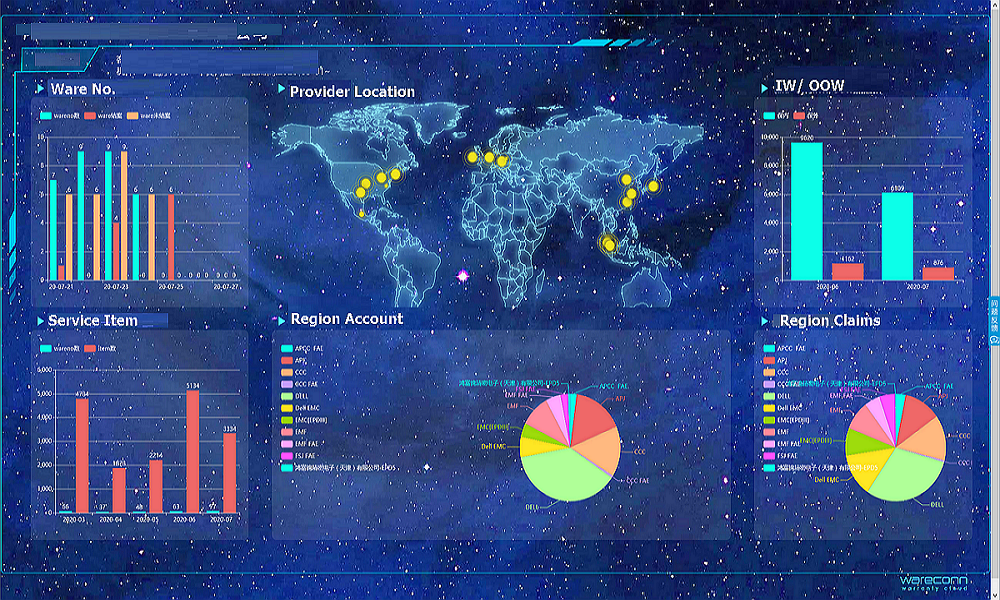
The function of "Dashboard" and "Statistical Chart" is officially online on July 27.
Now, you can log in warranty provider, customer and service center portal to make smarter use on dashboard.
1. Function:
Available to select the KPI item to make it apply in dashboard or statistical chart.
The differenct between dashboard and statistical chart is timing requirements.
For Dashborad: display nearly 7 days or 7 hours records (available to select product part no., serial name and other info to display)
For Statistical Chart: display historical records (available to select product part no., serial name and other info to display)
There are four type of dashboard/ statistical chart:
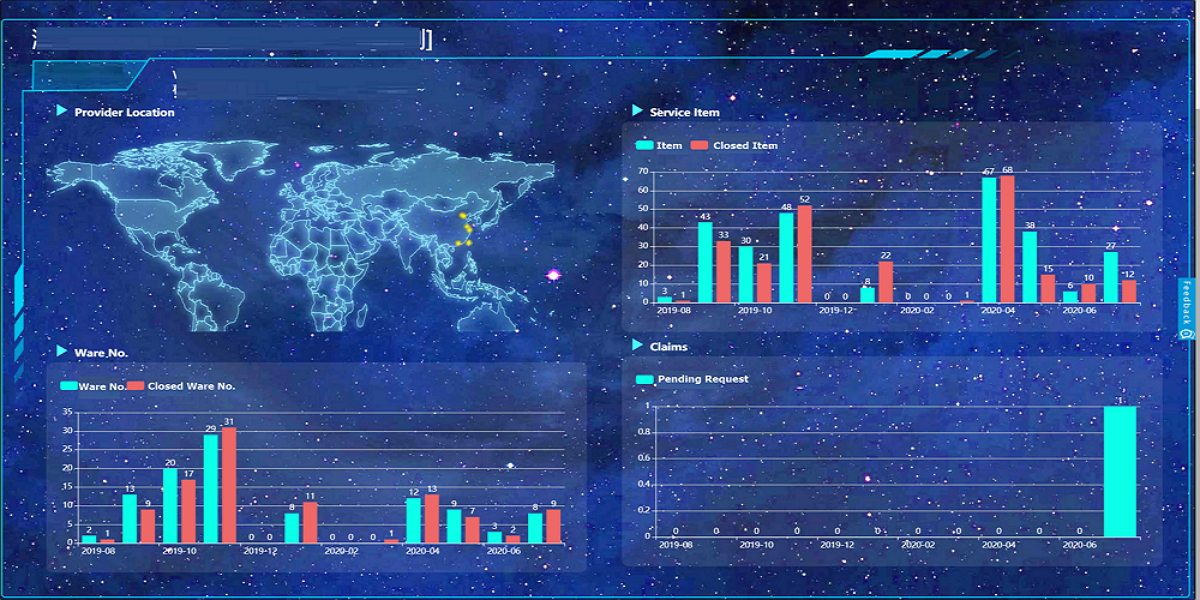
A. Warranty Provider – Warranty Management: view real-time warranty statistics such as product return (region), warranty type, request quantity, warranty content (IW/ OOW/ EW)
B. Warranty Provider – Repair Service: view real-time repair statistics of specific authorized service center such as station status, failure mode, receiving product return quantity
C. Customer: view associated provider location, real-time data of warranty claims, warranty type, and service type
D. Service Center: view real-time station status, processing/ non-processing product quantity, yield/ defective/ scrap rate and product return type
2. Portal: Warranty Provider/ Customer/ Service Center
3. SOP:
3.1 Warranty Provider
Warranty Provider/ Warranty Management/ Statistics/ Statistical Condition
Warranty Provider/ Repair Service/ Statistics/ Statistical Condition
Add new KPI item to make it apply in dashboard or statistical chart with different format such as pie chart, bar chart, stacked bar chart and line graph.
Click【Add 】to add new KPI item for further tracking
Click【![]() 】 to edit or click【
】 to edit or click【![]() 】to delete it
】to delete it

Fill in name and select function, type, x-axis and y-axis for application
(*Noted: "Function", "Type", and "X-Axis" are multiple-choice)

Warranty Provider/ Warranty Management/ Statistics/ Statistical Chart
Warranty Provider/ Repair Service/ Statistics/ Statistical Chart
Available to select customer, product serial name, part no., failure mode, product category and period for specific data review
Click【![]() 】to view it with selected items.
】to view it with selected items.
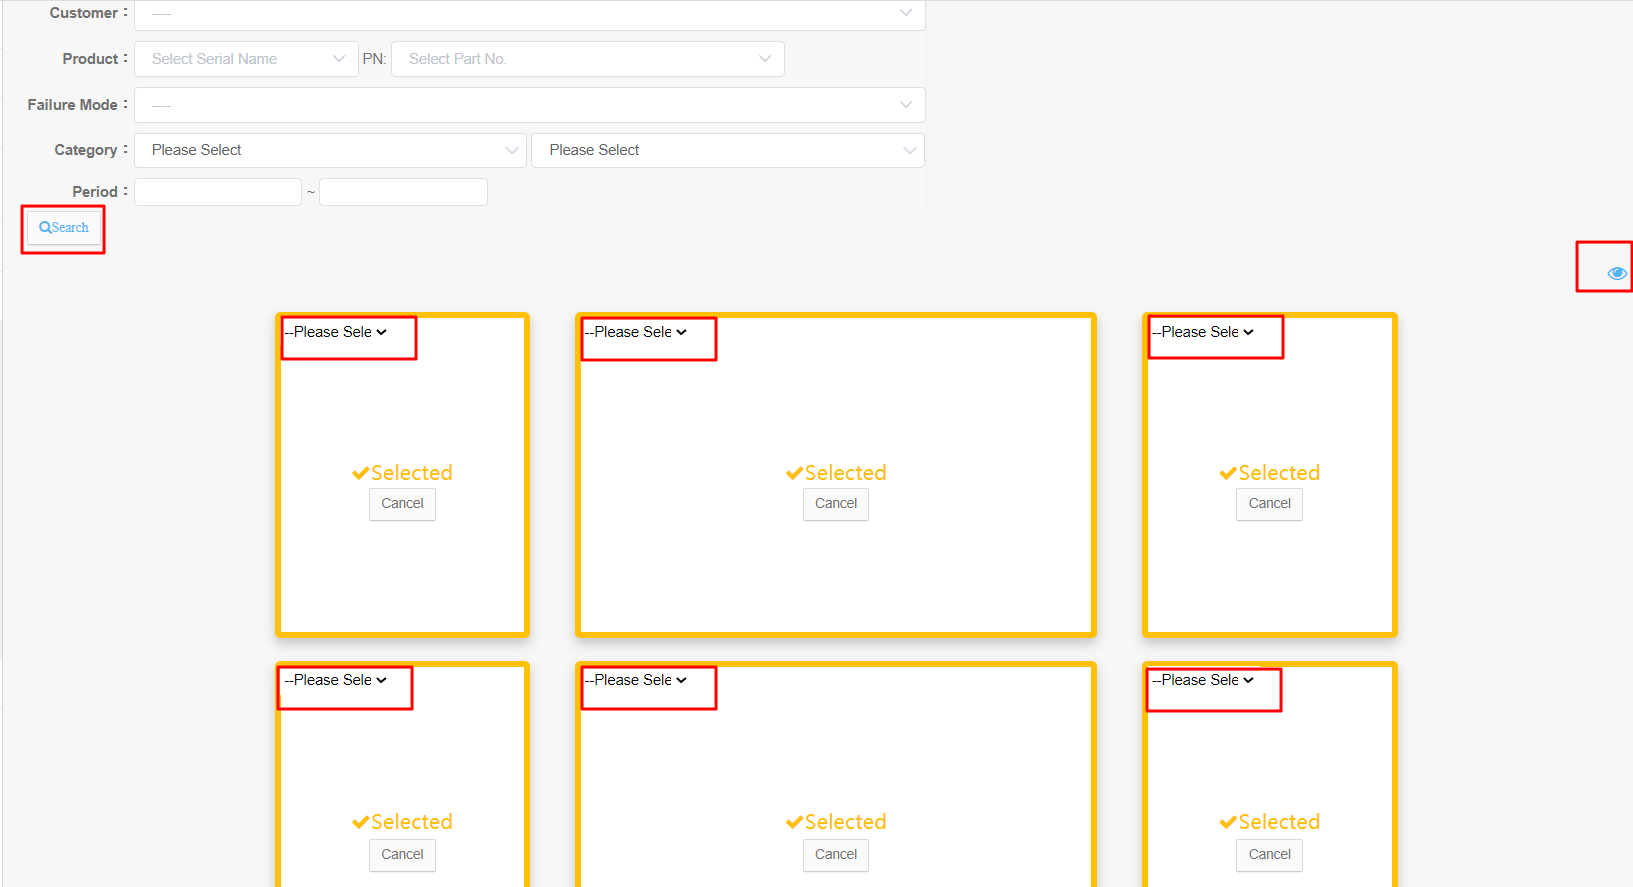
Warranty Provider/ Warranty Management/ Statistics/ Dashboard
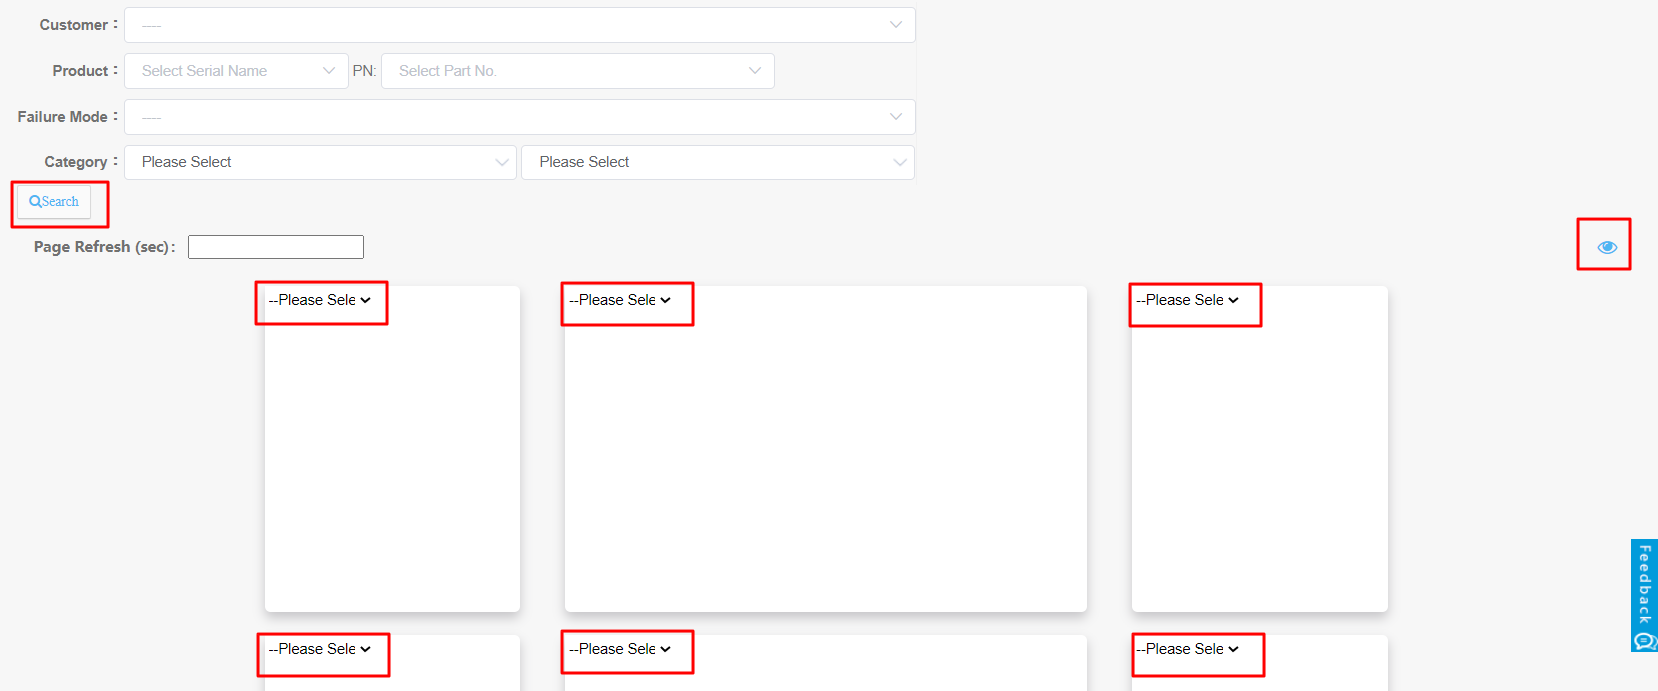
Warranty Provider/ Repair Service/ Statistics/ Dashboard
Available to select customer, product serial name, part no., failure mode, product category and period for specific data review
Click【![]() 】to view it with selected items.
】to view it with selected items.
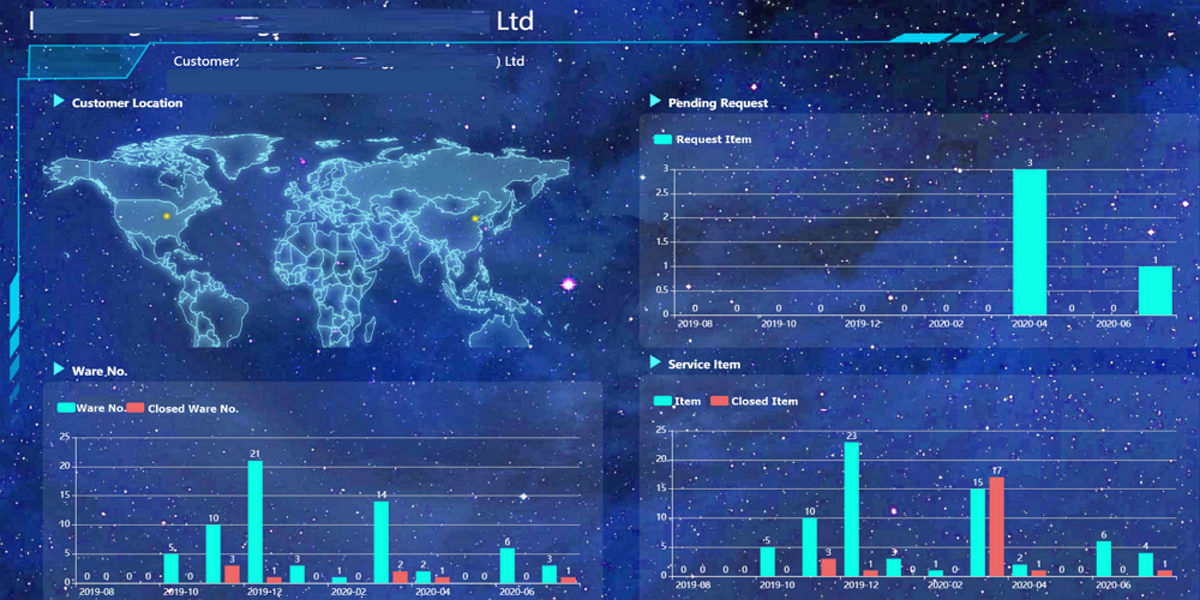
3.2 Customer
Customer/ Statistics/ Statistical Condition
Add new KPI item to make it apply in dashboard or statistical chart with different format such as pie chart, bar chart, stacked bar chart and line graph.
Click【Add 】to add new KPI item for further tracking
Click【![]() 】 to edit or click【
】 to edit or click【![]() 】to delete it
】to delete it

Fill in name and select function, type, x-axis and y-axis for application
(*Noted: "Function", "Type", and "X-Axis" are multiple-choice)

Customer/ Statistics/ Statistical Chart
Available to select customer, product serial name, part no., failure mode, product category and period for specific data review
Click【![]() 】to view it with selected items.
】to view it with selected items.

Customer/ Statistics/ Dashboard
Available to select customer, product serial name, part no., failure mode, product category and period for specific data review
Click【![]() 】to view it with selected items.
】to view it with selected items.

3.3 Service Center
Service Center/ Statistics/ Statistical Condition
Add new KPI item to make it apply in dashboard or statistical chart with different format such as pie chart, bar chart, stacked bar chart and line graph.
Click【Add 】to add new KPI item for further tracking
Click【![]() 】 to edit or click【
】 to edit or click【![]() 】to delete it
】to delete it

Fill in name and select function, type, x-axis and y-axis for application
(*Noted: "Function", "Type", and "X-Axis" are multiple-choice)

Service Center/ Statistics/ Statistical Chart
Available to select customer, product serial name, part no., failure mode, product category and period for specific data review
Click【![]() 】to view it with selected items.
】to view it with selected items.

Service Center/ Statistics/ Dashboard
Available to select customer, product serial name, part no., failure mode, product category and period for specific data review
Click【![]() 】to view it with selected items.
】to view it with selected items.

Please keep following us.
Your support is the driving force for continuous improvement.
Your suggestion is our motivation to make it better.